Table of Contents:
1. What is RFM Analysis?
2. Recency: [Time since last transaction]
3. Frequency: [Number of transactions]
4. Monetary: [Average Order Value per transactions]
5. Step One
6. Step Two
7. Step Three
8. RFM – Variations and Limitations:
9. Tableau Superstore RFM Analysis – Dashboard
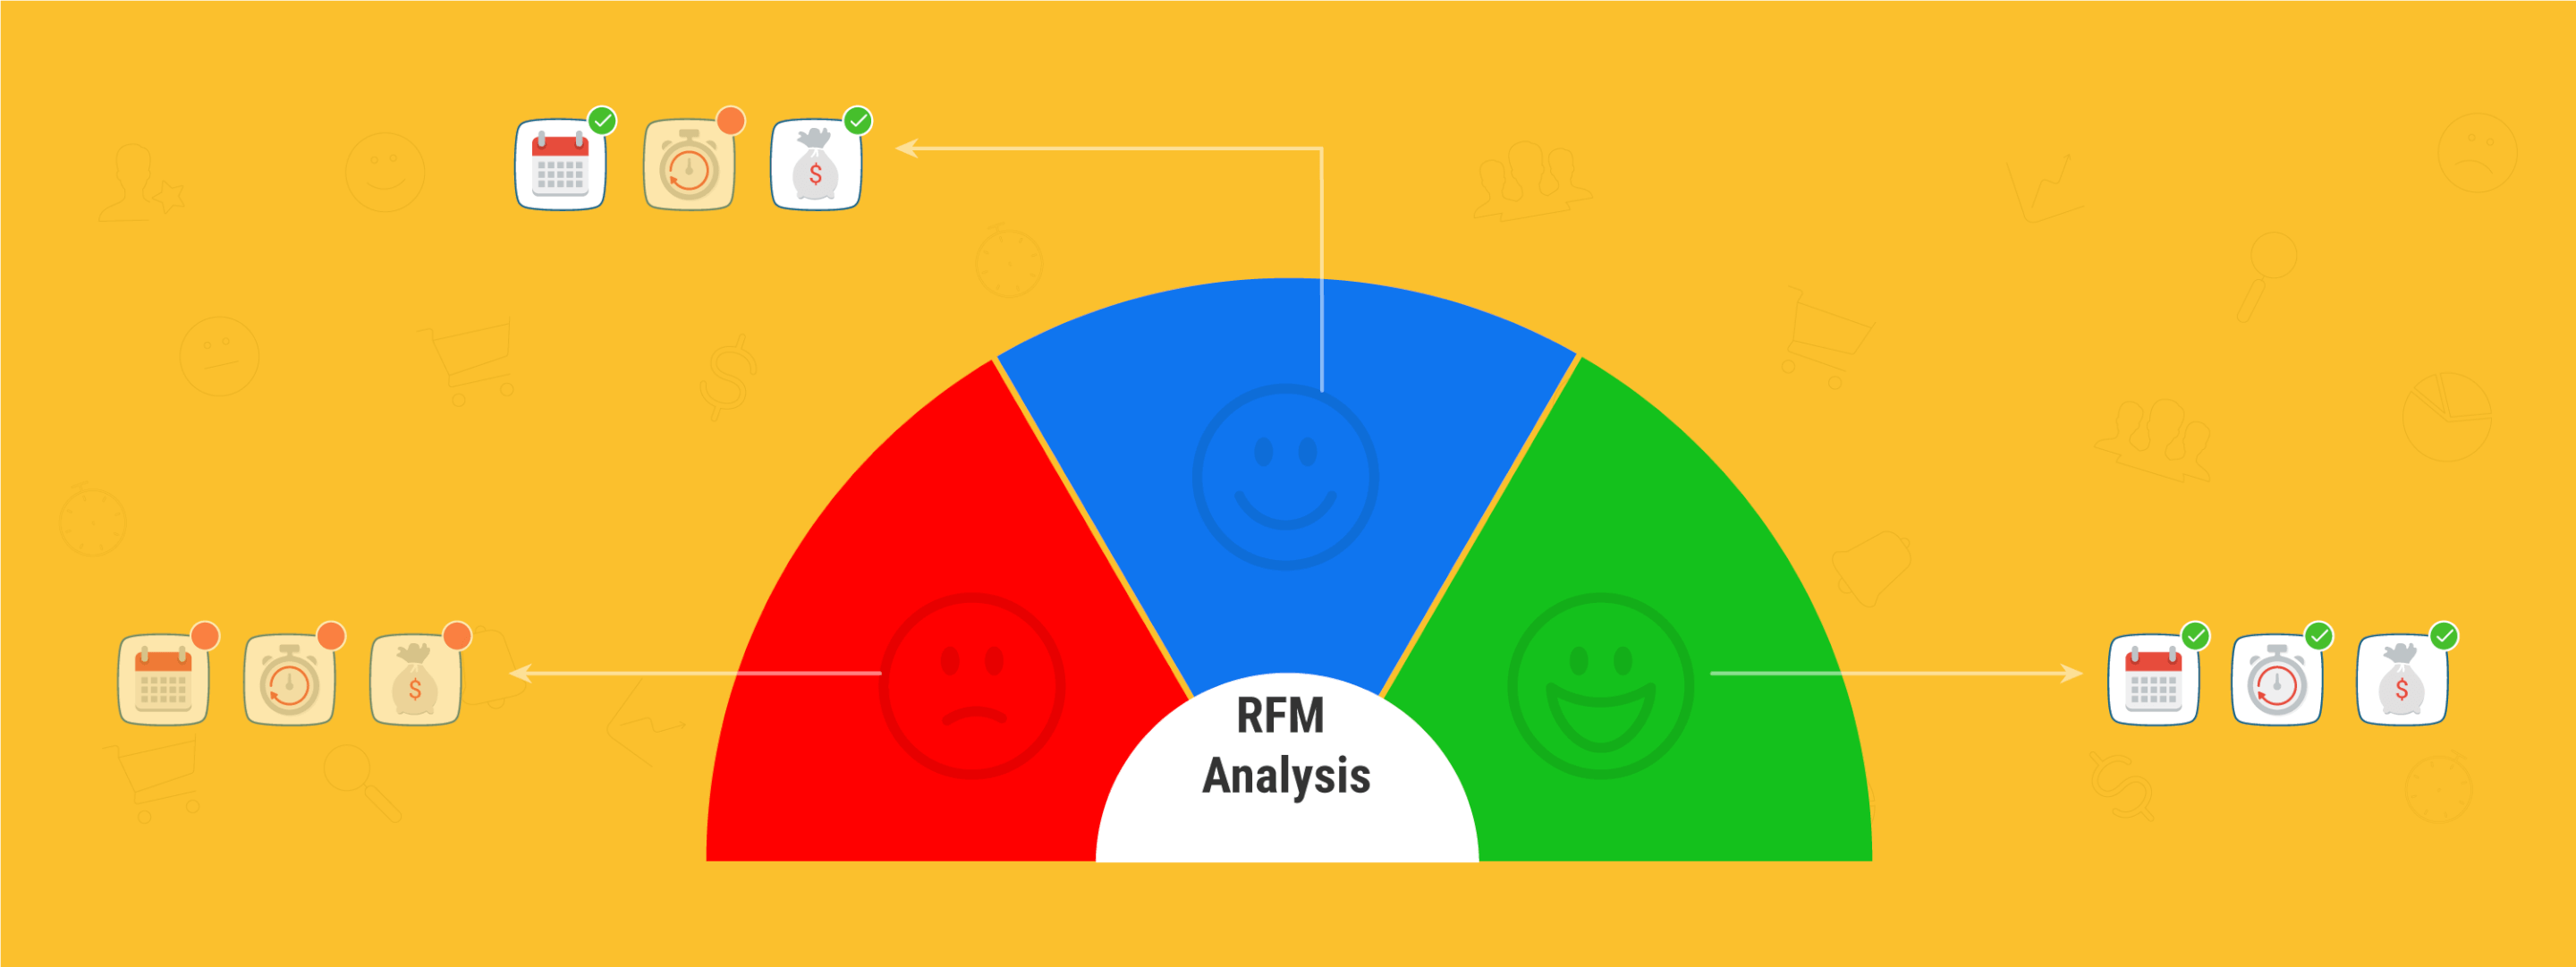
What is RFM Analysis?
One of the founding tenets of modern marketing is a widely used concept of Segmentation, Targeting and Positioning. STP has stood the test of time to stay relevant in these ever evolving, dynamic times.
At an elementary level segmentation is at the core of all successful marketing campaigns. Using segmentation you divide your audience into homogenous groups in order to send them relevant communication that resonates with them.
One such data backed segmentation technique is RFM segmentation, through RFM analysis you can segment your customers into buckets like best customers, loyal customers, big spenders, lost customers etc. much needed for customer lifecycle marketing.
RFM customer segmentation gained significant popularity in retail industry as such businesses capture the purchase data needed to segment customers using RFM.
Let’s get down to understanding the three RFM (Recency – Frequency – Monetary) variables & how they work:
-
Recency: [Time since last transaction]
- Time elapsed since the last interaction a customer did with your business. Often purchase is considered as interaction but there are activities like site visit, email open also taken as reference. Generally, the more recent the interaction the more responsive the customer is to your communication.
-
Frequency: [Number of transactions]
- The number of interactions a customer had within a specified period. It is a good indicator for singling out one time buyers from repeat buyers. Moreover, customers who are frequent buyers are likely to be more engaged and satisfied with your business.
-
Monetary: [Average Order Value per transactions]
- The contribution per transaction performed by a customer towards top line of a business. It is used to categorize high value purchasers from low value purchasers. For the fundamental reason – heavy spenders should be treated differently from the ones that spend little.
Download Impact Story – How Sulekha.com Increased Customer Lifetime Value By 3X
Benefits of implementing RFM Analysis within customer lifecycle marketing campaigns:
For implementing RFM segmentation analysis, it is recommended to use data for a longer time frame. For Upstarts, it could be since the inception of business. The time frame also depends on the nature of product category. Let’s illustrate the same with examples, recency of purchase for consumer durables is different from recency for consumables. Likewise, it is inappropriate for a subscription based product to sub-categorize the recency in days when the subscription is a minimum for a quarter.
Not setting the time-frame rightly may lead to skewed data and misrepresentation. If the time window is set too low the repeat buyers will fall into new customers (LR-LF). For the analysis to make sense, it is required to have data for considerably longer time frame.
Step One
These are the basic datasets you need to begin with RFM customer segmentation:
1. Transaction Identifier,
2. Transaction Date,
3. Transaction Value,
4. Customer identifier.
Using the data from the above transaction variables you’ll be able to get:
- 1. The count of days elapsed since last purchase date.
- 2. The accumulated number of transactions for each customer (count of transaction ID mapped by customer ID).
- 3. The accumulated value of transactions for each customer and hence average transaction value.
Step Two
Next you need to sub-categorize data further to define different buckets for each of the variables.
Depending on the volume of data, nature of repeat purchase and variation in average ticket size you can choose to define buckets based on Quartiles or even Deciles. For the sake of simplicity we have chosen to define three values – High, Medium and Low to each of the dimensions -Recency, Frequency and Monetary. The three values make a total of 27 combination (3x3x3) for RFM analysis.
| Recency | Frequency | Monetary | |
|---|---|---|---|
| High | HR | HF | HM |
| Medium | MR | MF | MM |
| Low | LR | LF | LM |
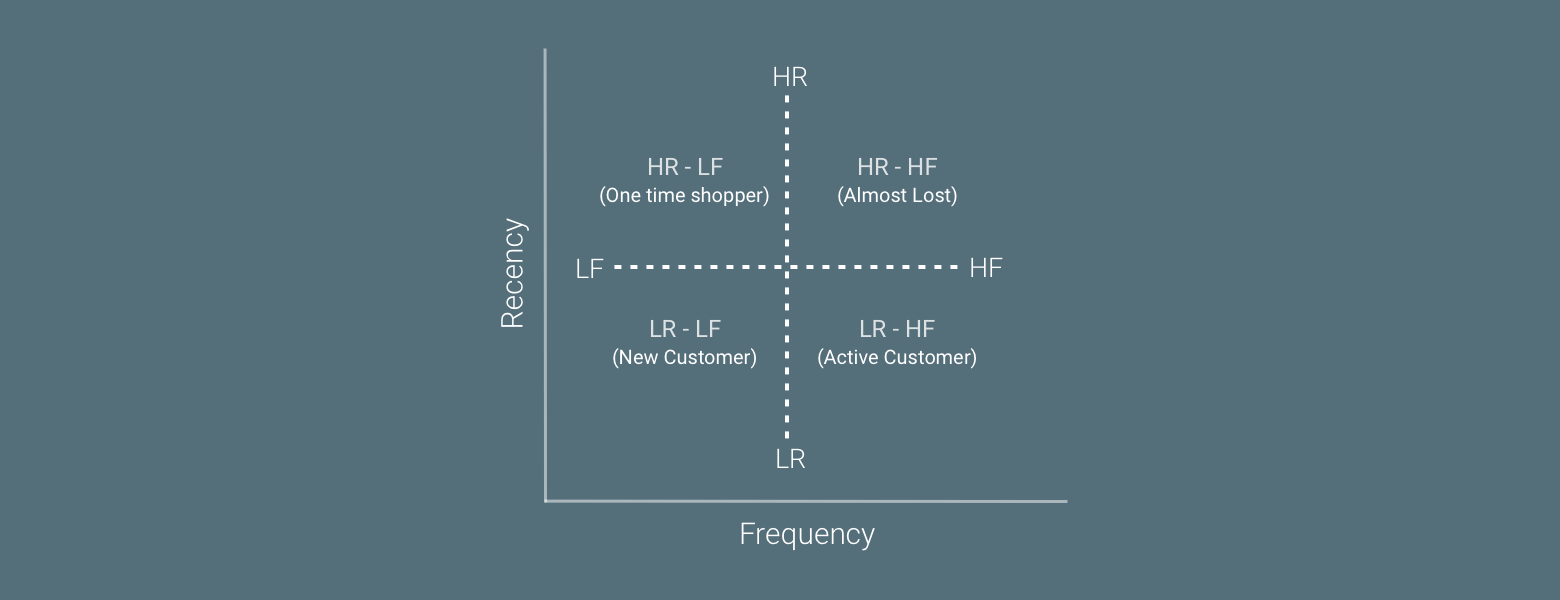
Note that recency is defined in a counter-intuitive manner that considers HIGH to represent a long time since last transaction and a LOW recency for a recent transaction. Consider a customer A who transacted 180 days before and customer B, who transacted just 15 days before. ‘A’ will have High Recency, and ‘B’ Low Recency.
Step Three
Using RFM analysis you’ll be able to categorize customers into different buckets.
| Segment | RFM | Description | Marketing Action |
|---|---|---|---|
| Best Customers | LHH | Customers who transacted recently, most frequently and spend the most. | Onboard them for a loyalty program, retain them. |
| Big Spenders | XXH | Customers with high spends | Opportunity to upsell and cross-sell. |
| Loyal Customers | LHX | Customers who transacted recently, and with high frequency. | Referral program. Gather feedback. |
| Churning Customer | HHH | High value customer, but most likely about to churn. | Reactivation campaign aimed to drive repeat purchase |
| Low value Lost Customers | HLL | Hasn’t transacted in a long time, with low number of transactions and spend little. | Re-engagement campaign |
| New Customer | LLX | Recently acquired customers | Personalized communication aimed to cross-sell. |
RFM – Variations and Limitations:
Variation of RFM include RFD and RFE, replacing Monetary Value by Duration and Engagement respectively. These variations are generally used by content websites that value metrics like time spent, viewership on their platform.
RFM segmentation focuses on just three variables while there could be others that are critical for a business. Another downside of RFM customer segmentation is it only takes historical data points in consideration while there are advanced techniques like predictive analytics that use AI to predict future customer behavior.
Would end this post with an example of RFM Analysis example done using quartile distribution for you to explore and see RFM analysis in practice.(source)
Download Case Study – Increase Your CLV By 3x. See how Sulekha, a classifieds website, did it.

 Vanhishikha Bhargava
 Niket Raja
 Ajit Singh